IRONMAN 70.3 · Mont-Tremblant · 20 Jun 2027
How to train for IRONMAN 70.3 Mont-Tremblant
The organiser describes this bike two ways on the same page. One line calls it a rolling cruise on closed roads with minimal turns. The course summary calls it hilly. Athletes pick whichever matches their hopes, and they are both wrong in the same way, because the two descriptions are not rival opinions. They are the first 72 km and the last 19 km.
That order is the whole story of the race. The cruise comes first, while you are fresh and nothing stops you riding too hard. The hills come last, when the cost of that shows up, and the run starts a few minutes after the final descent. A Trained athlete's 6:05:15 turns on whether they rode the flat roads with the finale in mind.
By Kian Briel, founder. Analysed by engine 1, updated
What is actually on the road
The organiser's own course files, drawn the way the Event Analyzer draws a member's race.
- Swim1.95 km0 m upCourse file
- Bike91.3 km887 m upCourse file
- Run21.2 km143 m upCourse file
The swim is one loop of Lac Tremblant, 2 km of lake water between mountain ridges, with a rolling start to spread the field. The organiser calls the water historically cozy at about 22 C. The logged figures run from 17 C in 2025 to 21 C in 2024.
The bike leaves the resort area on closed roads through the Laurentian Mountains and comes back to transition after 91.3 km. The file cuts it into 101 segments, and the early ones look gentle: a ramp of 7.4 percent near kilometre 15 and a 1.3 km drag at 5.8 percent past kilometre 51, with flat stretches of 10.3 km and 7.1 km in between. Then, from kilometre 72, the road climbs to the high point of the whole bike, about 111 m above the start, through a run of short climbs and descents as steep as 10 percent. Thirteen of the bike's thirty climbs of 3 percent or more sit in those last 19 km.
The run is a single out and back of 21.2 km through the Old Village of Tremblant and along the region's paved trails, mostly shaded, finishing in the heart of the Mont-Tremblant Village. The organiser calls it moderately rolling, and the file agrees in its own terms: 143 m of climbing, but only two rises that reach 3 percent. Everything between kilometre 2 and kilometre 17 reads as one flat segment.
Course shape by distance
- Flat 81%
- Climbing 10%
- Descending 9%
The longest stretches
- Bike, flat10.3 km11% of the bike
- Bike, climbing0.53 km2% of the bike
- Run, flat15.3 km72% of the run
Each row is one unbroken stretch of the course that keeps the same shape the whole way. The number is how much of that leg you spend inside it, and it comes out the same whether you are fast or slow.
What this course asks of each leg
Twelve training dimensions scored for each leg against its own course, the way the Event Analyzer scores a member's race.
Aerobic endurance leads on every leg at 85. On the bike, muscular endurance follows at 82, then threshold capacity and threshold durability level at 70. The bike carries 54 percent of a Trained athlete's day, so the seven biggest demands on the course all belong to it before the run's first entry appears at eighth.
The bike's distinctive number is high-intensity capacity at 58, against 42 on the run and 40 on the swim. Strength and force reads 49 on the bike. Neither comes from a long climb, because there is none. The longest is the 1.3 km drag at kilometre 51. They come from the repeated short efforts of the finale, where the road asks for a minute or two above steady power, then gives it back on a descent, then asks again.
Put a Trained athlete on it. They swim 39:13, ride 3:16:05 at 182 W and run 1:59:57. The Competitive band, at 5:16:20, rides 2:50:30 from 4.15 W/kg at 75 kg. Climbing is an eighth of the bike's distance, yet half of the time between those two bike splits is found going uphill. Power on the climbs is where a faster athlete earns their gap, and it is also where a slower one loses the run.
Weather has varied. The highs were 20 C in 2026 and 19 C in 2025, then 29 C in 2024. The low in 2025 was 10 C, which makes for a cold start by a lake in June.
- Aerobic endurance85
- Muscular endurance80
- Threshold capacity70
- Aerobic durability65
- Technical skill65
- Threshold durability65
- Fueling resilience55
- High-intensity capacity40
- Anaerobic capacity25
- Strength / force20
- Environmental resilience10
- Sprint power5
Nymiva reads what you can already show, from your own data
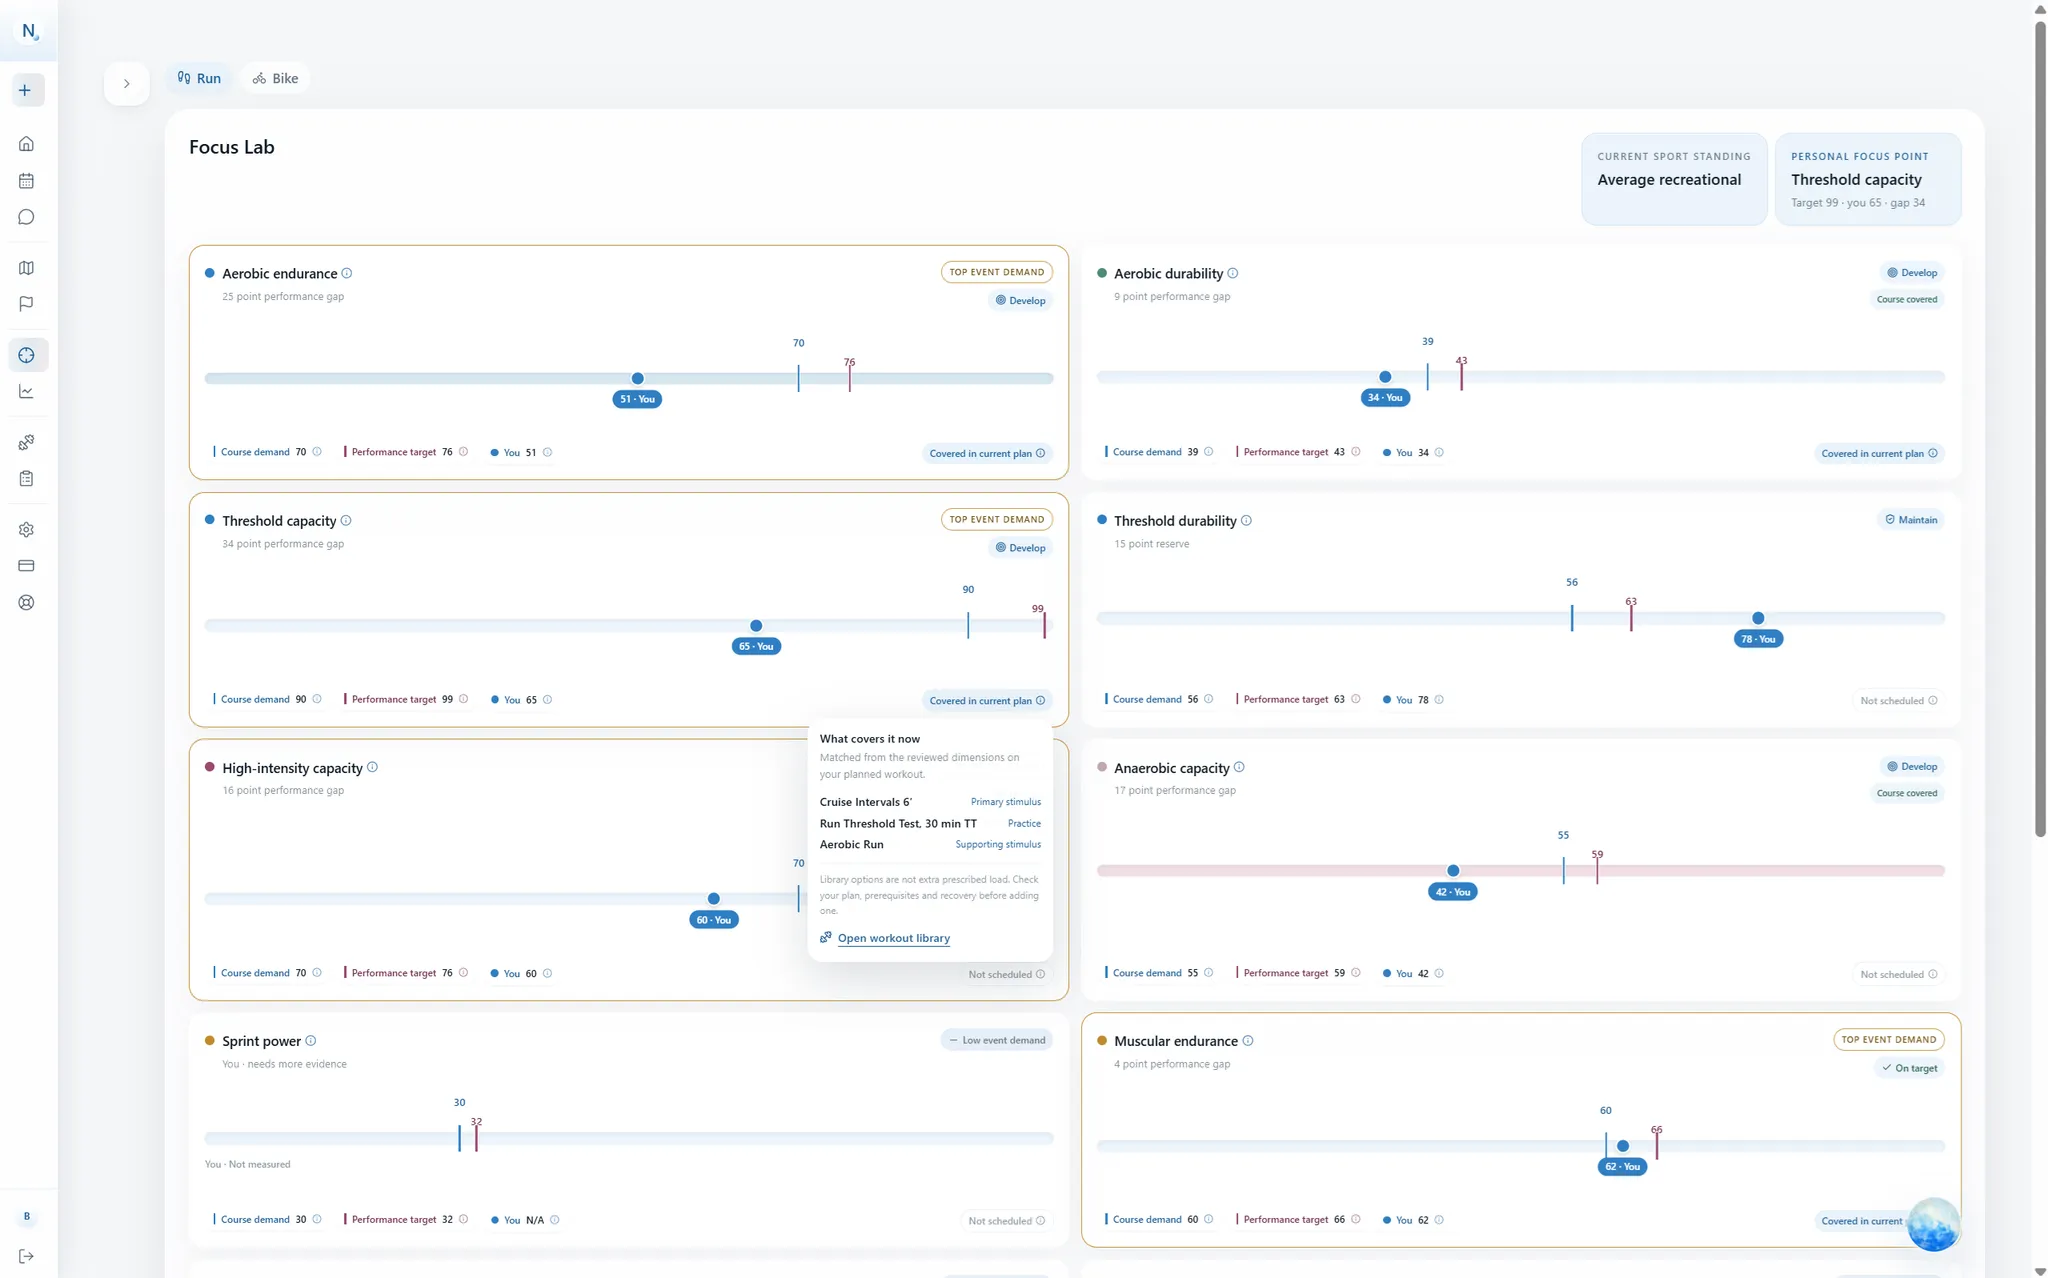
Connect your training history and the Focus Lab scores the same twelve dimensions this course demands against where you sit today. The gap between the two is what you train.
- MeasuredFrom your thresholds and testsThreshold power, threshold pace, critical swim speed and field tests you have done. The dimensions they can carry are scored directly.
- EstimatedFrom your training historyConnected activities are read for what they prove: long efforts, late-session fade, repeated hard work, fueling on long days. Each score says how it was read.
- ProxyFrom a stand-in, and named as oneWhere only an indirect signal exists, the score carries the proxy it came from and a lower confidence, never a number dressed as a measurement.
- UnmeasuredHonestly blankA dimension nothing in your data can answer stays unmeasured. It is never a zero, and the plan does not pretend to know it.
Every dimension ends in one word
- Develop the course asks more than you can show
- Maintain close enough to hold at the minimum dose
- Covered nothing to build here
- Unmeasured the course needs it, your data cannot say yet
Nymiva treats the demand scores above as half of a comparison. It scores the athlete on the same twelve dimensions, drawn from their thresholds and the history they connect, and marks each score with how it was read and how much it can be trusted. A gap only exists where the course outscores the athlete. Each gap is then weighted by the share of race time its leg takes, which on this course puts the bike's gaps well ahead of anything in the lake.
The page has no reader behind it, so the season it shows assumes the reader's gaps match Mont-Tremblant's biggest demands. That assumption yields 24 weeks: 5 developmental blocks, then a two-week taper. Aerobic endurance leads the opening block in all three sports. Threshold capacity leads the bike's second block and threshold durability its third, with the run taking them in the opposite order. Muscular endurance leads the fourth block across the board, and aerobic endurance leads the fifth. A member's own numbers produce a different season.
Train the bike to protect the run
Which demands matter most across the whole race. A leg's demand counts for as much of the day as that leg takes, so a score of 85 on the bike outweighs the same score on the swim.
- 01Aerobic enduranceBike leg, 54% of the day85 × 54%46
- 02Muscular enduranceBike leg, 54% of the day82 × 54%44
- 03Threshold capacityBike leg, 54% of the day70 × 54%38
The bike takes 54% of the Trained reference band’s day, so its demands carry the most race weight. What the bike leaves in the legs is what the run gets.
Which demand gets a block, and when
The engine freezes one lead focus per sport on every developmental block, holds the rest at maintenance, and verifies before it reprioritises.
An illustration, not your plan. This page has none of your data, so the season below is the engine’s answer to one stated assumption: that your gaps line up with what IRONMAN 70.3 Mont-Tremblant demands. Your own season is built from your history, your thresholds, the days you can train and the races you have entered, and it will differ from this in its priorities, its sessions and its load.
- 01Run muscular endurance, a practice block4 weeks
- 02Run aerobic endurance, a development block4 weeks
- 03Bike muscular endurance, a practice block4 weeks
- 04Bike aerobic endurance, a development block4 weeks
In the order the allocator places them, general first, most race-like last.
- Week 1PrepPrep
A lead-in week. It develops nothing by design.
- Weeks 2 to 5Foundation 1Closes with a recovery week
- PriorityBike aerobic endurance
- PriorityRun aerobic endurance
- PrioritySwim aerobic endurance
- SupportBike muscular endurance
- SupportRun muscular endurance
- SupportSwim muscular endurance
- SupportBike threshold capacity
- SupportBike threshold durability
- SupportRun threshold capacity
- SupportSwim threshold capacity
- SupportRun threshold durability
- SupportSwim aerobic durability
- Weeks 6 to 9Foundation 2Closes with a recovery week
- PriorityBike threshold capacity
- PriorityRun threshold durability
- PrioritySwim aerobic durability
- SupportBike aerobic endurance
- SupportRun aerobic endurance
- SupportSwim aerobic endurance
- SupportBike muscular endurance
- SupportRun muscular endurance
- SupportSwim muscular endurance
- SupportBike threshold durability
- SupportRun threshold capacity
- SupportSwim threshold capacity
- Weeks 10 to 13Foundation 3Closes with a recovery week
- PriorityBike threshold durability
- PriorityRun threshold capacity
- PrioritySwim threshold capacity
- SupportBike aerobic endurance
- SupportRun aerobic endurance
- SupportSwim aerobic endurance
- SupportBike muscular endurance
- SupportRun muscular endurance
- SupportSwim muscular endurance
- SupportBike threshold capacity
- SupportRun threshold durability
- SupportSwim aerobic durability
- Weeks 14 to 17Event shaping 1Closes with a recovery week
- PriorityBike muscular endurance
- PriorityRun muscular endurance
- PrioritySwim muscular endurance
- SupportBike aerobic endurance
- SupportRun aerobic endurance
- SupportSwim aerobic endurance
- SupportBike threshold capacity
- SupportBike threshold durability
- SupportRun threshold capacity
- SupportSwim threshold capacity
- SupportRun threshold durability
- SupportSwim aerobic durability
- Weeks 18 to 21Event shaping 2Closes with a recovery week
- PriorityBike aerobic endurance
- PriorityRun aerobic endurance
- PrioritySwim aerobic endurance
- SupportBike muscular endurance
- SupportRun muscular endurance
- SupportSwim muscular endurance
- SupportBike threshold capacity
- SupportBike threshold durability
- SupportRun threshold capacity
- SupportSwim threshold capacity
- SupportRun threshold durability
- SupportSwim aerobic durability
- Weeks 22 to 23PeakPeak
The taper. Load comes down toward the race, content stays specific.
- Week 24RaceRace
Race week.
Held at maintenance between blocks
- Runmuscular endurance, aerobic endurance, aerobic durability, threshold capacity, threshold durability
- Bikemuscular endurance, aerobic endurance, aerobic durability, threshold capacity, threshold durability
- Swimaerobic endurance, aerobic durability, threshold capacity, threshold durability, muscular endurance, technical skill
Touches scheduled by each capability’s own decay, at a fraction of its development dose, so earlier work is still there on race day.
The sessions the blocks are built from
One entry per kind of work the block trains, at the intensity that work is meant to be done at. Where the same work runs at several lengths, the entry shows the span it grows across rather than one entry per length.
- Foundation 1 · Weeks 2 to 575 to 240 min
150 to 210 min at Zone 2
BikePower, Zone 2Trains aerobic capacity - Foundation 1 · Weeks 2 to 540 to 270 min
180 to 210 min at Zone 3, then 30 min at Zone 4
BikePower, Zone 3Trains aerobic capacity - Foundation 1 · Weeks 2 to 535 to 120 min
90 min at Zone 2
RunPace, Zone 2Trains aerobic capacity - Foundation 1 · Weeks 2 to 550 min
4 x 1.5 min at Zone 3, 6 min easy between
RunHeart rate, Zone 3Trains aerobic capacity - Foundation 1 · Weeks 2 to 545 to 51 min
4 x 8 min at Zone 2, 1 min easy between
SwimPace, Zone 2Trains aerobic capacity - Foundation 1 · Weeks 2 to 547 to 81 min
3 x 1000 m at Zone 3, 0.3 min easy between
SwimPace, Zone 3Trains aerobic capacity
12× rolling-course surges
0.8 min at Zone 5, then 0.8 min at Zone 5, then 0.8 min at Zone 5, then 0.8 min at Zone 5, then 0.8 min at Zone 5, then 0.8 min at Zone 5, then 0.8 min at Zone 5, then 0.8 min at Zone 5, then 0.8 min at Zone 5, then 0.8 min at Zone 5, then 0.8 min at Zone 5, then 0.8 min at Zone 5, 3.3 min easy between
Compiled by the deterministic course compiler from the organiser’s file: the course’s one repeatable requirement, rehearsed at a dose the progression allows.
- Bike
- 70 min
- Trains threshold durability
- Supports muscular endurance
- Supports high intensity capacity
24 weeks, laid out backwards from race day
The shortest runway Nymiva builds for this event type, with its blocks, recovery weeks, taper and race week in place.
- 1
- 2
- 3
- 4
- 5
- 6
- 7
- 8
- 9
- 10
- 11
- 12
- 13
- 14
- 15
- 16
- 17
- 18
- 19
- 20
- 21
- 22
- 23
- 24
- Prep
- Foundation
- Event shaping
- Peak
- Race
- Recovery week
Your own season carries these same phases on your own dates, with the load solved from your fitness and the days you can train, and it changes when your data does.
What each level does on the day
Reference finish times per peer band, the pacing plan the model holds each band to, and where the day is decided.
| Band | Swim | Bike | Run | Finish |
|---|---|---|---|---|
| Recreational2:11 /100m critical swim speed · 2.47 W/kg at 75 kg · 6:08 /km threshold pace | 0:46:17 | 3:38:09 | 2:24:15 | 6:58:41 |
| Trained1:51 /100m critical swim speed · 3.03 W/kg at 75 kg · 5:06 /km threshold pace | 0:39:13 | 3:16:05 | 1:59:57 | 6:05:15 |
| Competitive1:36 /100m critical swim speed · 4.15 W/kg at 75 kg · 4:20 /km threshold pace | 0:33:55 | 2:50:30 | 1:41:55 | 5:16:20 |
| Elite1:26 /100m critical swim speed · 5.27 W/kg at 75 kg · 3:50 /km threshold pace | 0:30:23 | 2:35:43 | 1:30:09 | 4:46:15 |
Pacing plan
- 0 km0.1%30.3 km/h1:37
- 0.82 km3.8%15.7 km/h0:42
- 1 km-2.6%43.5 km/h0:16
- 1.19 km4.3%14.4 km/h0:52
- 1.4 km1.4%24.2 km/h1:49
- 2.13 km-4.1%50.3 km/h0:43
- 2.73 km6.2%10.9 km/h1:58
- 3.08 km-0.7%34.3 km/h3:48
93 more segments in the full plan.
- Run: reach 4:20 /km and this course gives back 48:55.
Where it is decided
After kilometre 72, on a bike that has saved its questions for the end.
The engine singles out the 529 m at 7.8 percent near kilometre 76 as the steepest sustained climb. It takes 2 percent of the bike leg. The decision is not made on that ramp alone. It is made across thirteen climbs in 19 km, each short, each with a descent after it that invites you to treat the next one as a sprint. Hand this bike file to the engine and ask for a session, and it returns twelve efforts of 45 seconds in Zone 5 with a little over three minutes of easy riding between them. That is a fair picture of the finale, and a warning about it.
The run makes the price clear. It opens with a 5.4 percent rise near kilometre 2, then settles into the flat stretch that holds 72 percent of the run leg. A rider who held 182 W through the finale finds a rhythm on that flat and keeps it. A rider who raced the last 19 km of the bike spends the first rise recovering and the next 15 km trying to find a pace that is not there.
Getting it wrong
Riding the flat 10 km after kilometre 22 too hard. Closed roads, minimal turns, a fresh field. The engine gives this stretch 10.5 percent of the bike leg, the largest share of any single segment, and it is where riders set a power they cannot bring to kilometre 72.
Treating the finale as a finish. The last 19 km feel like the end of the bike, so riders empty themselves into them. They are really the start of the run. Keep the climbs at the same effort as the flat roads, and let the descents at 10 percent be recovery rather than a chance to catch back up.
Pacing the run off the shade. The organiser calls the run mostly shaded, and on a day like 2024, with a high of 29 C, that matters. A Trained athlete starts running around four hours after the start. Shade lowers the cost of a pace. It does not make a pace set in cool training weather right for a warm June day.
Conditions on the day
- 2026high 20 C, low 13 Cwater 20 C
- 2025high 19 C, low 10 Cwater 17 C
- 2024high 29 C, low 14 Cwater 21 C
From the organiser’s own records. Not a forecast.
Every session is a claim, every block is a test
A plan is not a calendar. Each key session states what it trains and how that is checked, and each block ends with a public verdict before the next one is chosen.
What a block promises
Bike aerobic endurance moves from your baseline to a stated target by the end of Foundation 1
- The baseline is your measured score when the block starts. The target is the score the model predicts for it.
- Verified at the block’s recovery week, by a field test or a refresh of the supply read from your history.
- Confidence rises by agreement between independent signals, never by one metric crossing a line.
- A block that misses its target is a public miss. The next block is chosen from what was proven, not from what was planned.
- 01Stimulus achievedThe work landed in the zone the session named, for the dose it named.
- 02Partially achievedSome of the work landed. The session banks what it can prove.
- 03Not achievedThe load may have been there. The stimulus was not, so nothing is banked.
- 04Data insufficientNo usable stream. The session is neither credited nor blamed.
- Session verified
- Progression banked
- Block verified
- Priority reassessed
- Plan adapted
Your numbers, this course
Analyze IRONMAN 70.3 Mont-Tremblant against my fitness
The same simulation and the same Focus Lab read, on your thresholds instead of a band’s. Three numbers give a finish estimate and a partial read. A connected history gives the whole table.
The first 14 days are free.
- Trained band finish
- 6:05:15
- Of the day on the bike
- 54%
- Dimensions scored per leg
- 12
- Season runway shown
- 24 wk
Questions people ask
- How hilly is the IRONMAN 70.3 Mont-Tremblant bike course?
- The organiser labels it hilly and also calls it a rolling cruise on closed roads with minimal turns, and both are true in turn. The file measures 887 m of climbing over 91.3 km. Long flat stretches dominate the first 72 km, and 13 of the bike's 30 climbs of 3 percent or more come after that, including the steepest, 529 m at 7.8 percent.
- What is the water temperature in Lac Tremblant?
- The organiser calls it historically cozy at around 22 C. The logged figures are 20 C in 2026, 17 C in 2025 and 21 C in 2024. The swim is one loop with a rolling start. The wetsuit decision is not on the course page, so check it in race week.
- Is the IRONMAN 70.3 Mont-Tremblant run hilly?
- Less than the bike. It is one out and back loop through the Old Village of Tremblant and along paved trails, mostly shaded, with 143 m of climbing. The organiser calls it moderately rolling. Only two rises reach 3 percent, and a single flat stretch of more than 15 km fills most of it.
- How long is the season on this page?
- The illustrative season runs 24 weeks, with five developmental blocks and a two-week taper. It is built from the course alone. A member's season is built from their own numbers and can be longer.
Course data from the organiser’s published files, analysed 24 Sept 2026 by engine 1, demand model 4. Reference times are simulated for a peer band at a stated reference athlete and are not a prediction for anyone. Nothing on this page is medical advice.
IRONMAN® and IRONMAN 70.3® are registered trademarks, and 5150 is a trademark, of World Triathlon Corporation. Nymiva is an independent training platform and is not affiliated with, sponsored by or endorsed by World Triathlon Corporation. Course data is read from the organiser’s public course pages for the purpose of describing the event.