Measuring whether the training actually worked
Load is not adaptation and completion is not success. Power and pace curves, efficiency, decoupling and durability, all measured from your own efforts.
Load is not adaptation, and completion is not success. You can finish every session on the calendar, hit every load target, tick every box, and arrive at your event no faster than you left. Whether the training worked is a different question, and it needs different evidence: did the specific ability you were training measurably improve, in the conditions your race will ask for it.
Key takeaways
- A completed session and a successful session are different outcomes. Scheduled, started, completed, executed correctly, stimulus achieved and stimulus missed all mean different things.
- Your power and pace curves are built from every real effort you upload, not from one test you did in March.
- Output per heartbeat is only comparable on long steady sessions, so it is trended separately from interval work.
- Decoupling and durability answer the question a fresh-legs test never can: what is still there late in a long effort.
- Thresholds are estimated from your actual best sustained efforts, shown with the efforts behind them, and never applied without you accepting them.
- No single number is a verdict. Performance leads, wearable numbers nudge.
Load is a guardrail. Adaptation is the goal
Training load tells you how much stress you absorbed. It does not tell you whether the stress produced the adaptation it was prescribed for. A threshold session can land exactly on its load target while every interval sat a zone too low, which is a completed session and a failed stimulus at the same time.
So sessions are not scored as done or not done. Scheduled, started, completed, executed correctly, stimulus achieved, stimulus partially achieved, stimulus missed, data insufficient, stopped appropriately and guardrail violation are separate outcomes, because they lead to different next moves. Stopping a quality session at its stop rule is a pass. Riding through it at the wrong intensity to protect a number is not. What that verdict then does to next week is covered in how a plan turns into this week and today.
What you can hold, and for how long
Every activity that syncs is broken down into your best rolling efforts at a ladder of durations. That is the mean-maximal curve, and it is drawn from real training and racing rather than a single test you did once and have been quietly deferring to ever since. Bike efforts produce a power curve. Run efforts produce a pace curve, plus fastest times at the distances that matter, from 1 km to 80 km.
The curve is useful because it separates improvements that look identical on a calendar. If your five-minute best climbs and your twenty-minute best does not, you got sharper, not more durable. If the whole curve lifts, the aerobic base moved. On the bike there is a second curve computed from variability-weighted power, because past roughly an hour average power understates what the ride actually demanded of you.
Speed streams are cleaned against a physical ceiling before any of this runs. A GPS jump or a mis-read pool wall is a sensor artefact, and without that filter it becomes a permanent five-second personal best that nothing can dislodge.
Efficiency, and why only steady sessions count
Efficiency here means output per heartbeat: your power, or your pace adjusted for gradient, divided by your average heart rate. Rising over a block is the aerobic system building. Flat after a solid block usually means the stimulus is spent, which is a reason to switch emphasis and hold the old work at roughly half the frequency, then retest in six to eight weeks.
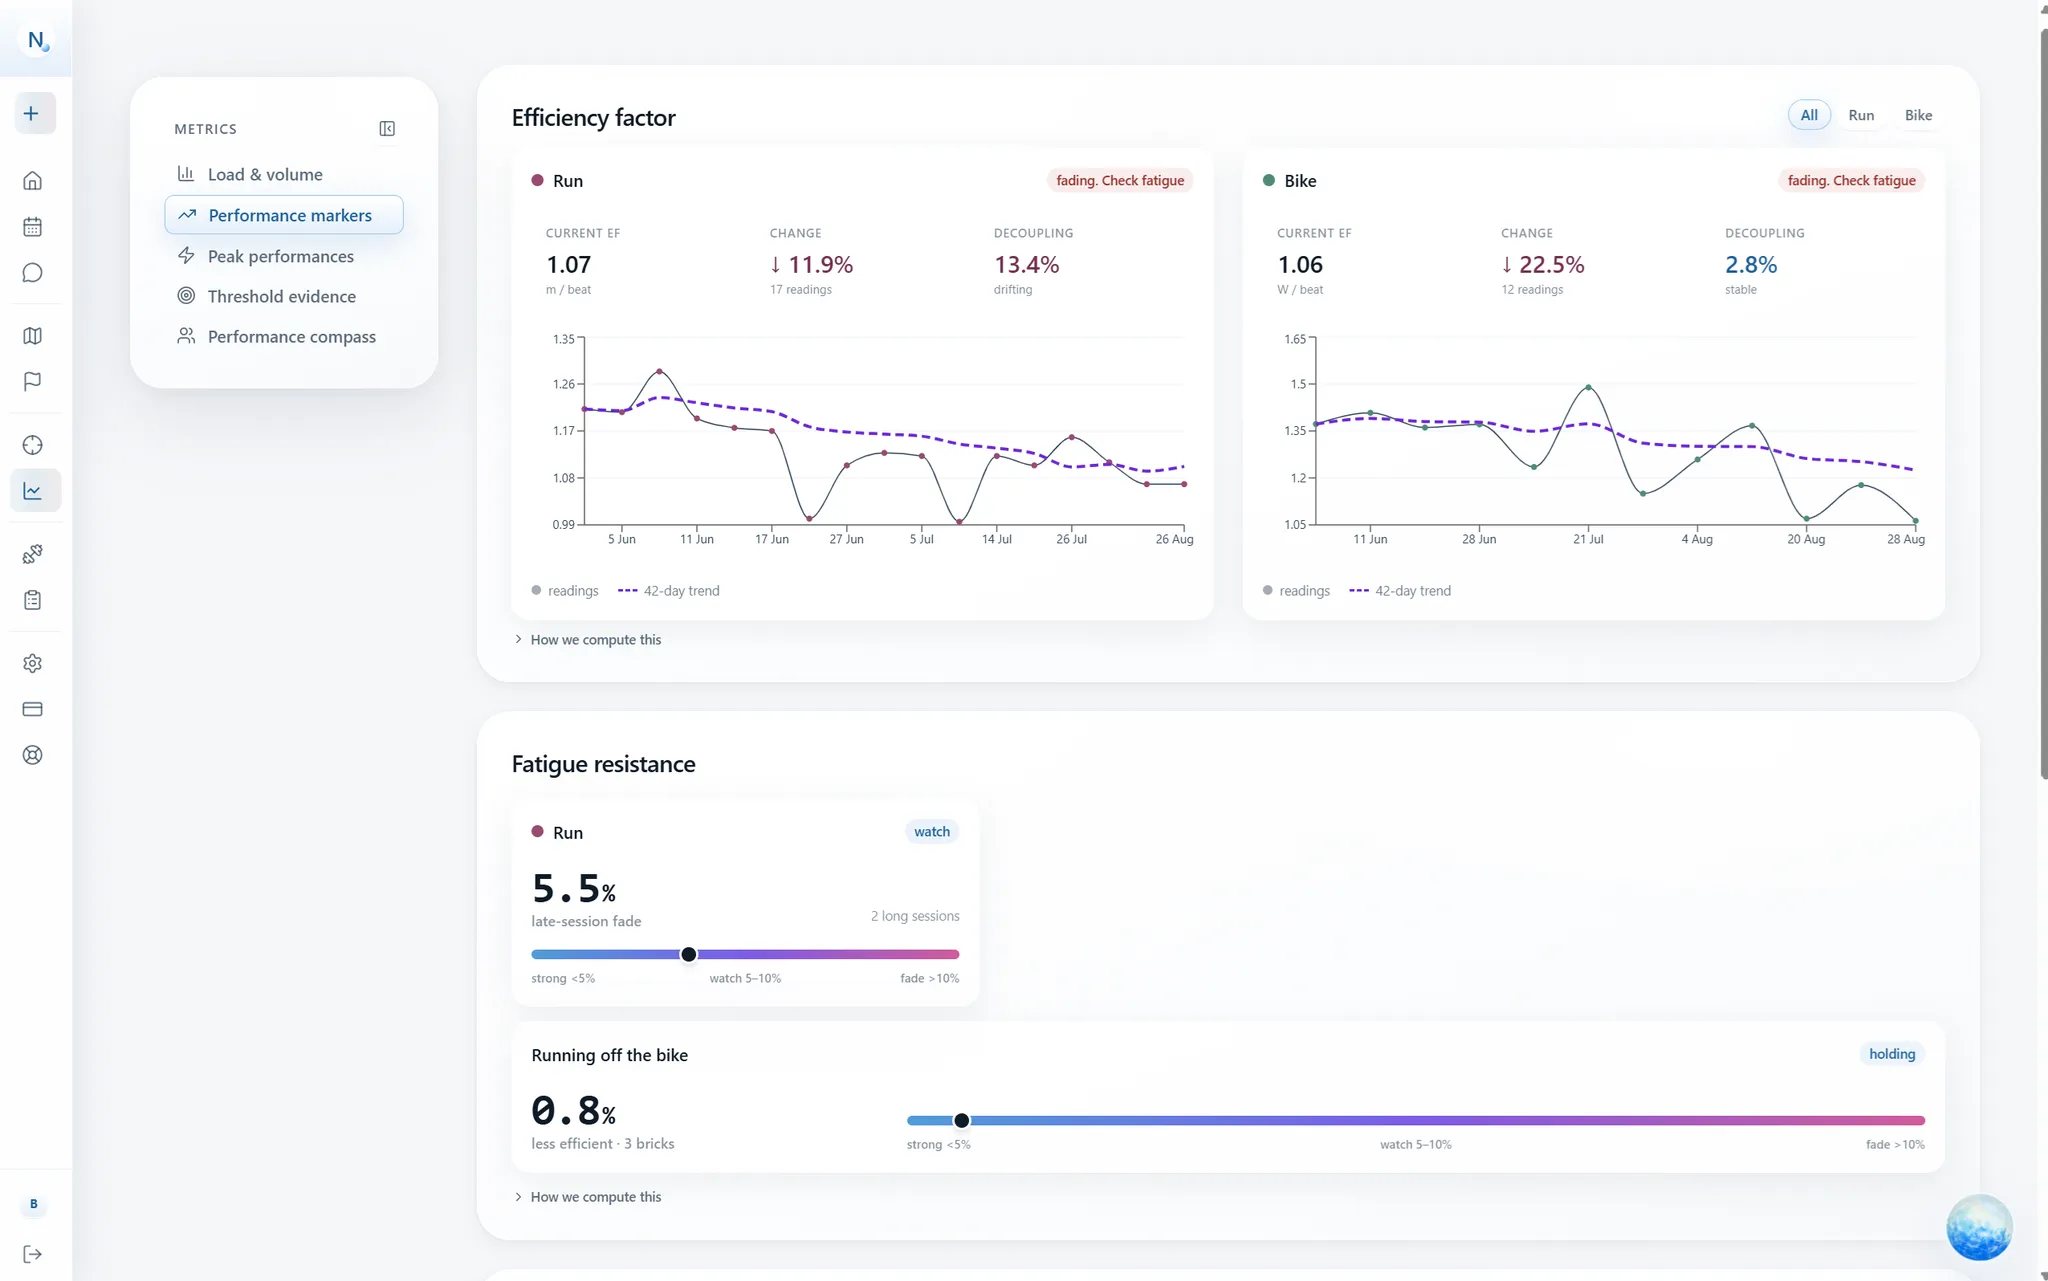
The catch is that this number is only comparable across sessions of the same kind. An interval session inflates it, because the gap between a surge-weighted power figure and an average heart rate widens with every hard rep, with no aerobic adaptation behind it. So a separate, comparable trend is kept, emitted only for efforts of at least thirty minutes that were genuinely steady. That is a narrower stream of data points on purpose. A trend built from incomparable readings is worse than no trend.
Decoupling: when output drifts away from heart rate
Decoupling asks whether your output per heartbeat held together across a session. Positive means heart rate drifted upward relative to what you were producing, which is the classic aerobic-fatigue signature on a long steady effort. Five percent or less is durable. Five to ten percent points at a durability gap. Above ten percent says the effort was beyond what your aerobic system could hold at that duration.
It is computed only for efforts of at least forty-five minutes that were steady throughout, and it is simply absent otherwise. Decoupling on an interval session measures the workout's structure, not your cardiac drift, and reporting it anyway would be a number that looks like evidence and is not.
Durability: what is left late in a long effort
Durability is the ability that decides races and the one a fresh-legs test is structurally incapable of showing. Twenty minutes at threshold on rested legs tells you nothing about your threshold four hours in, which is when your event will ask.
Three reads exist, and each needs different evidence. Within-session fade compares output per heartbeat in the first quarter of a long steady session against the final quarter, on sessions of ninety minutes or more, judged against the same durability thresholds as decoupling. On the bike there is a work-gated probe: your best five and twenty minute power after 2,000 kJ of accumulated work, set beside your fresh bests for the same durations. That one is gated on work actually done rather than clock time, so it can surface on a hard ride that never qualifies as a long steady one. And for run and bike, best efforts taken only from the portion of a session after an hour of prior work are tracked separately from the fresh curve.
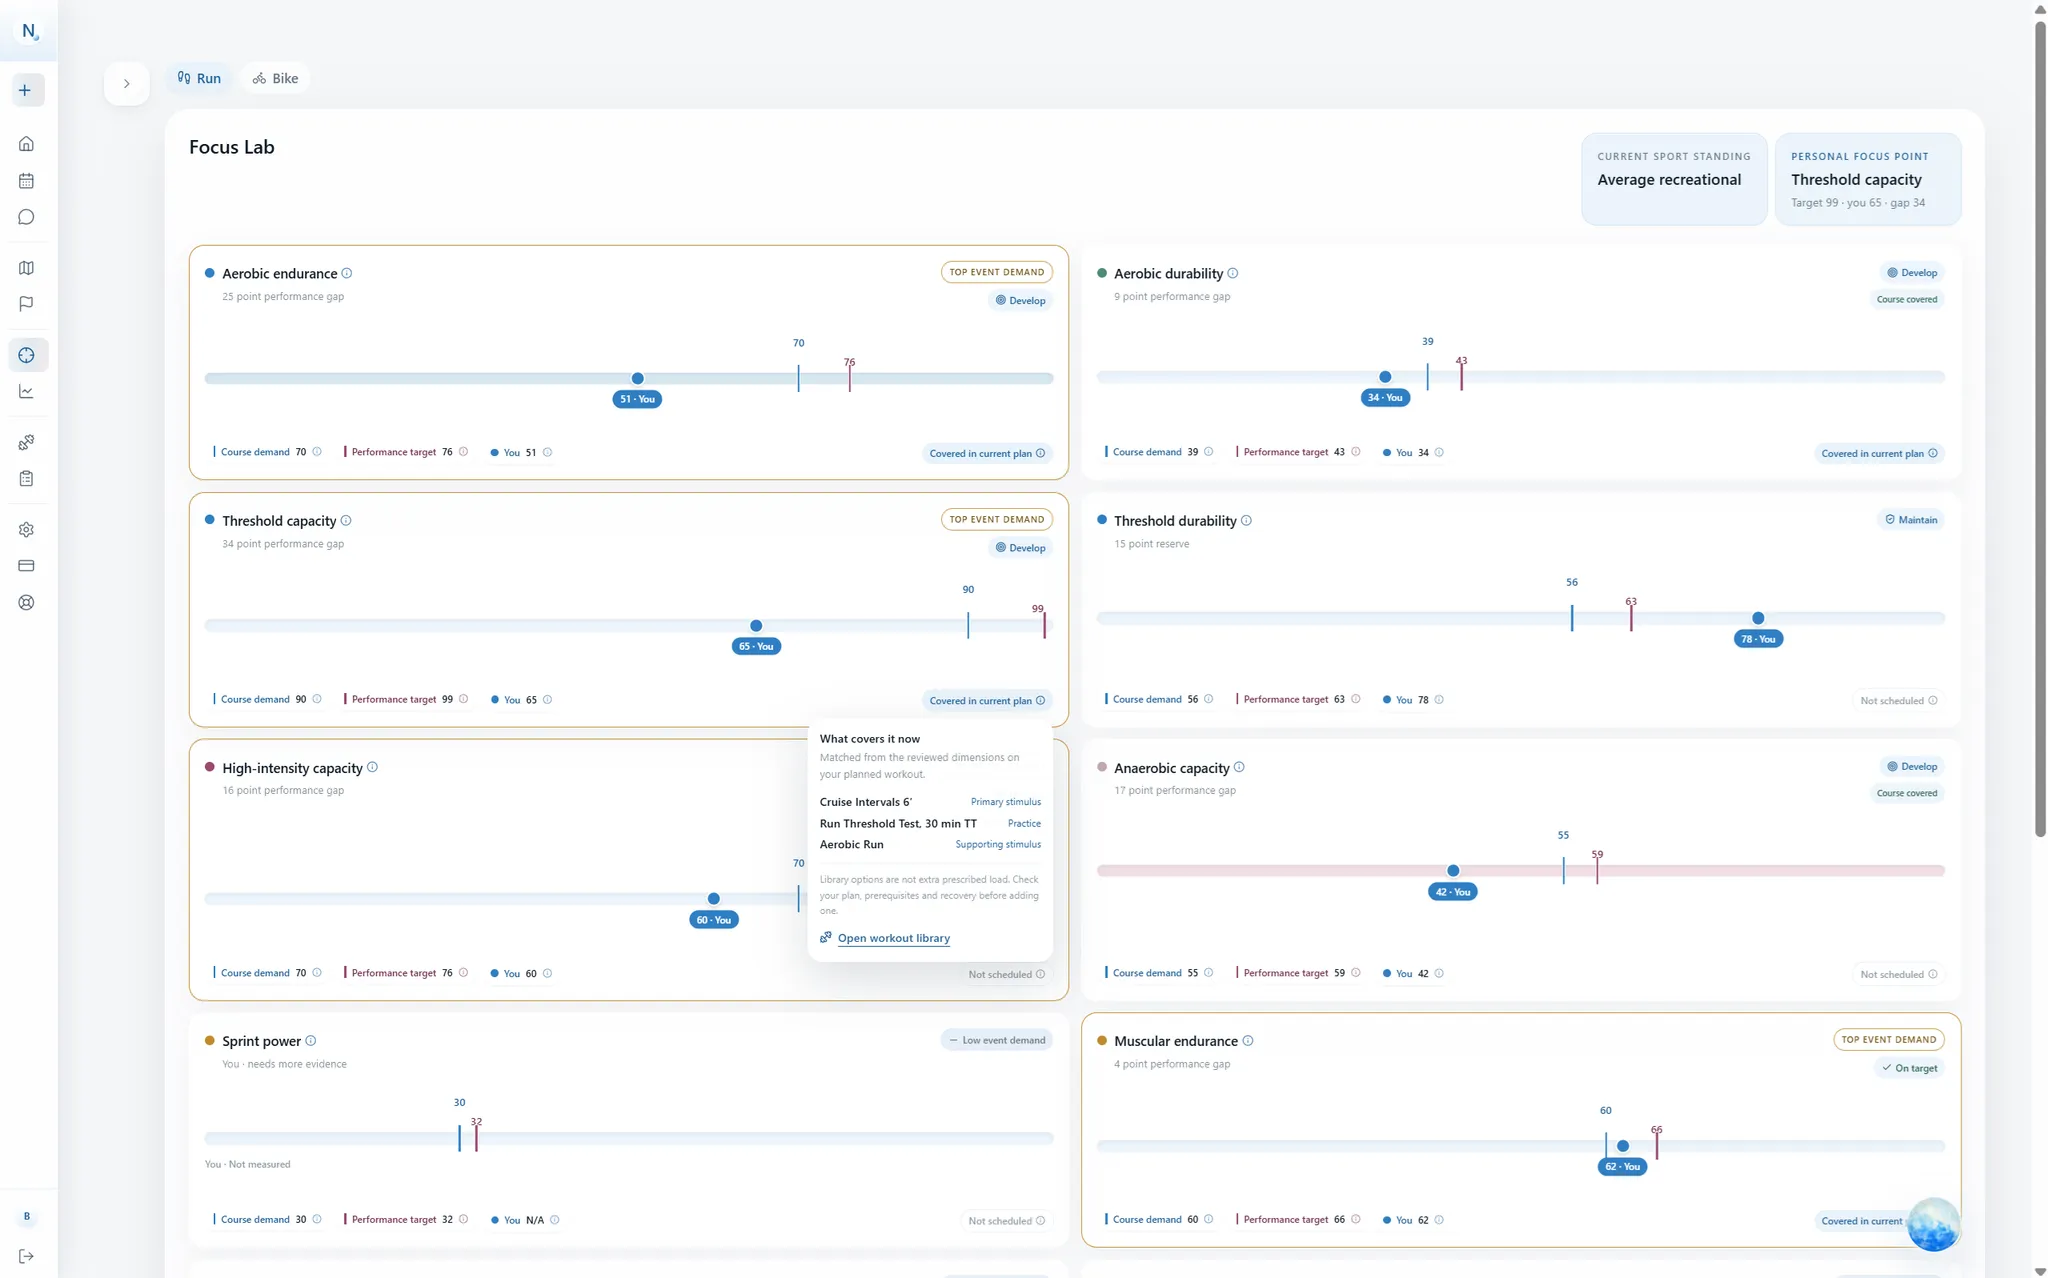
For multi-sport athletes the same logic runs on brick runs. A run starting shortly after a ride is compared against your own standalone steady-run efficiency from the previous six weeks, which turns running well off the bike into a measured quantity rather than a hope. These readings feed straight into the gap analysis in the Focus Lab.
Thresholds you can argue with
Thresholds are estimated from your best real sustained efforts on the curve, never from whole-activity averages and never from a factor applied to a guess. Functional threshold power comes from your best recent twenty-minute power. Threshold heart rate comes from your best recent twenty-minute heart rate. Threshold pace comes from your best recent thirty-minute pace.
Every estimate arrives with its receipt: how many qualifying efforts it drew on, over what window, the range those efforts spanned, and the individual efforts with their dates. Confidence is shown as what it is, a labelled quality score for the evidence, not a physiological measurement. Nothing is silently applied. A new estimate is a proposal you can accept, ignore or disagree with, and disagreeing is informative, because a number you know is wrong is a number you can point at.
When the analysis engine itself improves, your entire history is recomputed against the new version in the background. There is no re-analyse button, because a stale metric is not a state you should have to notice and fix.
No single metric is a stoplight
Every verdict is a synthesis of several signals, including what you report subjectively. Performance is the primary signal. Wearable and load-derived numbers nudge a verdict, they never decide one on their own.
There is a concrete reason for that discipline. Heart rate is suppressed under deep fatigue, so a single-number readiness score reads a genuinely dug hole as fresh legs, on precisely the morning that mistake costs the most. Convergence between independent signals is what raises confidence, not one metric crossing a line.
Where a signal points at pain, illness or something outside training, it is escalated to you and to a professional. It is not diagnosed and it is not treated.
Without a power meter
All of this degrades gracefully. The curves become pace curves, gradient-adjusted where elevation data allows. Perceived effort is treated as first-class data rather than a comment field, and athletes training on heart rate get more subjective monitoring, not less, along with wider margins on how fast load is allowed to climb, precisely because heart rate hides fatigue.
Features that genuinely require power are absent, with a stated reason, rather than faked from an estimate. The 2,000 kJ durability probe needs measured work. Quadrant analysis needs power, cadence and a dated threshold, and when any of those is missing the numbers are simply not computed instead of being filled in with plausible ones. The diagnosis gets less precise. The planning does not stop.
What lands on the Performance surface is that evidence, organised: load and volume, performance markers, peak performances, threshold evidence, and the compass placing your bests against age-adjusted benchmark levels. Reading those charts covers what each one can tell you, and the question each one cannot answer.